Scope 1, 2, and 3 emissions have become the global language of corporate climate reporting. Under frameworks such as the Corporate Sustainability...


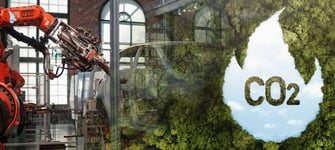
Scope 1, 2, and 3 Emissions: What EU Businesses Need to Know
Scope 1, 2, and 3 emissions have become the global language of corporate climate reporting. Under frameworks such as the Corporate Sustainability...


.png?width=370&height=150&name=EUDR-header(1).png)

.png?width=370&height=150&name=product-compliance-header(2).png)
.png?width=370&height=150&name=svhc-header(1).png)
.png?width=370&height=150&name=tsca-ipoint(1).png)
.png?width=370&height=150&name=eu-battery-regulation-header(1).png)
.png?width=370&height=150&name=elv-directive-header(1).png)

%20(1)%20(1).webp?width=370&height=150&name=Green-Deal-Bild-bearbeitet2%20(2)%20(1)%20(1).webp)


.png?width=370&height=150&name=eu-conflict-minerals-regulation-header(1).png)

.png?width=370&height=150&name=camds-header(1).png)

.png?width=370&height=150&name=csrd-scope3-header(1).png)
.jpg?width=370&height=150&name=responsible-minerals-header(1).jpg)


%20(3).png?width=370&height=150&name=iPoint%20Blog%20Image%20Automotive%20Trend%20Study%20(mit%20Nummern)%20(3).png)

%20(2).png?width=370&height=150&name=iPoint%20Blog%20Image%20Automotive%20Trend%20Study%20(mit%20Nummern)%20(2).png)
%20(1).png?width=370&height=150&name=iPoint%20Blog%20Image%20Automotive%20Trend%20Study%20(mit%20Nummern)%20(1).png)
-1.png?width=370&height=150&name=iPoint%20Blog%20Image%20Automotive%20Trend%20Study%20(mit%20Nummern)-1.png)


.jpg?width=370&height=150&name=1920x768_C(1).jpg)

.jpg?width=370&height=150&name=Kopie%20von%20iPoint%20Blog%20Image%201500%20x%20500%20px%20(4).jpg)
.jpg?width=370&height=150&name=Kopie%20von%20iPoint%20Blog%20Image%201500%20x%20500%20px%20(3).jpg)


.jpg?width=370&height=150&name=Kopie%20von%20iPoint%20Blog%20Image%201500%20x%20500%20px%20(1).jpg)

-1.jpg?width=370&height=150&name=Kein%20Titel%20(1500%20%C3%97%20500%20px)-1.jpg)


.webp?width=370&height=150&name=Bild%20CD%20LAB%201-1%20(1).webp)
%20(1).webp?width=370&height=150&name=iso-14000-familiy-1500x500-1024x%20(1)%20(1).webp)

%20(1).webp?width=370&height=150&name=Bild%201%20(1)%20(1).webp)
.webp?width=370&height=150&name=2-2%20(1).webp)
.webp?width=370&height=150&name=Hubspot_Landingpage_1920x775-2%20(1).webp)
.webp?width=370&height=150&name=Blog_CD-Lab_DT-for-SPM_Feature5-2%20(1).webp)
.webp?width=370&height=150&name=Blog_CD-Lab_Digital-Battery-Passport-2%20(1).webp)
.webp?width=370&height=150&name=Collect-Blogarticle_1500-500-2%20(1).webp)
.webp?width=370&height=150&name=Trend-survey-title-image_1500x50%20(2).webp)
.webp?width=370&height=150&name=yash-bindra-RaTPEIwuwXw-unsplash%20(1).webp)
.webp?width=370&height=150&name=20210825_Blog_SFRD-3%20(1).webp)
%20(1).webp?width=370&height=150&name=meagan-carsience-RmERRki7BCw-unsplash-3%20(1)%20(1).webp)
.webp?width=370&height=150&name=Trends-Survey-Automotive-2020-3%20(1).webp)

-1.webp?width=370&height=150&name=Duty-of-Care-Germany_March21-Nov%20(1)-1.webp)
.webp?width=370&height=150&name=fly-d-oNBlbvQ2jAc-unsplash-3%20(1).webp)

.webp?width=370&height=150&name=Header-Nov-30-2022-12-59-35-9621%20(3).webp)
.webp?width=370&height=150&name=Carbon-transparency-teaser-3%20(1).webp)
.webp?width=370&height=150&name=CD-Labor-Update%20(1).webp)
%20(1)-1.webp?width=370&height=150&name=CARE-1024x345%20(1)%20(1)-1.webp)
.webp?width=370&height=150&name=Suite2%20(1).webp)
%20(1).webp?width=370&height=150&name=expanding-compliance2-1024x342%20(2)%20(1).webp)
%20(1).webp?width=370&height=150&name=from-compliance-to-sustainability-3-new-1500x500-1%20(1)%20(1).webp)

%20(1).webp?width=370&height=150&name=2020-09_CM-Cobalt-1024x343%20(1)%20(1).webp)
%20(1).webp?width=370&height=150&name=electronics-wp-1500x500-1024x341%20(1)%20(1).webp)

%20(1).webp?width=370&height=150&name=Blume-1024x342%20(1)%20(1).webp)
.webp?width=370&height=150&name=Lies-vs-True%20(1).webp)
%20(1).webp?width=370&height=150&name=medtec-india-china_1500x500-1024x341%20(1)%20(1).webp)
%20(1).webp?width=370&height=150&name=medtec_trends-1500x500-1024x341%20(1)%20(1).webp)
%20(1).webp?width=370&height=150&name=product-sustainability-2-1500x500-1024x341%20(1)%20(1).webp)
%20(1).webp?width=370&height=150&name=scs-1500x500-1024x341%20(1)%20(1).webp)
-1.webp?width=370&height=150&name=suite-intro-1142x510-1024x457%20(2)-1.webp)
%20(1)-1.webp?width=370&height=150&name=suite-city-1142x510-1024x457%20(1)%20(1)-1.webp)
%20(1).webp?width=370&height=150&name=unlimted-ideas-1500x500-1024x341%20(1)%20(1).webp)
.webp?width=370&height=150&name=E-Mobility-Sustainability%20(1).webp)
%20(1).webp?width=370&height=150&name=Featured_Image_Supermarket-1024x346%20(1)%20(1).webp)
%20(1).webp?width=370&height=150&name=crt-1500x500-1024x341%20(1)%20(1).webp)
.webp?width=370&height=150&name=car-1500x500-1024x341%20(1).webp)
.webp?width=370&height=150&name=featured_image_1%20(1).webp)
%20(1).webp?width=370&height=150&name=brexit-uk-reach-1500x500-1024x341%20(1)%20(1).webp)
.webp?width=370&height=150&name=trends-survey-2019-1024x341%20(2).webp)
%20(1).webp?width=370&height=150&name=ipca-web_1-1500x500-1024x341%20(1)%20(1).webp)
.webp?width=370&height=150&name=trends-2018_1-1500%20(1).webp)
%20(1).webp?width=370&height=150&name=roadmap-1500x500-1024x341%20(1)%20(1).webp)
%20(1).webp?width=370&height=150&name=france-1500x500-1024x341%20(1)%20(1).webp)
%20(1).webp?width=370&height=150&name=L%C3%A4gerdorf-1024x354%20(1)%20(1).webp)
.webp?width=370&height=150&name=blockchain-1500x500_new-1024x341%20%20(1).webp)
%20(1).webp?width=370&height=150&name=iso-5001-energy-efficiency-1500x500-1024x341%20(1)%20(1).webp)
%20(1).webp?width=370&height=150&name=header-recipe-1500x500-1024x341%20(1)%20(1).webp)
%20(1).webp?width=370&height=150&name=csm_CW_ebook_HumanRights_2018-03%20(1)%20(1).webp)
%20(1).webp?width=370&height=150&name=surfing2-1500x500-1024x341%20(1)%20(1).webp)
.webp?width=370&height=150&name=iPoint_Blog_LifeCycle_Portfolio_2018-07_EN_1500x50%20(2).webp)
.webp?width=370&height=150&name=iPoint-systems_TOP100_Innovator%20(1).webp)
.webp?width=370&height=150&name=ifu-Hamburg-Team-620x310-1%20(2).webp)
.webp?width=370&height=150&name=Child-labour-620x310%20(1).webp)
%20(1).webp?width=370&height=150&name=Victor-Vladimirov_Blog%20(1)%20(1).webp)
.webp?width=370&height=150&name=Rebecca-LeBlanc_Pic%20(2).webp)
%20(1).webp?width=370&height=150&name=taxes-accounting%20(1)%20(1).webp)
%20(1).webp?width=370&height=150&name=UN-Global-Compact_w-1024x422%20(1)%20(1).webp)
%20(1).webp?width=370&height=150&name=EU-CSR-Reporting-Directive-1024x%20(1)%20(1).webp)
%20(1).webp?width=370&height=150&name=Innovation_iPoint_Emerson_Verdan%20(1)%20(1).webp)
%20(1).webp?width=370&height=150&name=iPoint_Blog_Digital-Circular-Eco%20(1)%20(1).webp)
%20(1).webp?width=370&height=150&name=Involvement-of-different-departe-1%20(1)%20(1).webp)
%20(1).webp?width=370&height=150&name=Titelbild_v11-1%20(1)%20(1).webp)
%20(1).webp?width=370&height=150&name=Flow_Dave13-1024x495-1%20(1)%20(1).webp)
%20(1).webp?width=370&height=150&name=ktf_freighter-travel%20(1)%20(1).webp)
%20(1).webp?width=370&height=150&name=ktf_water-footprinting%20(1)%20(1).webp)
.webp?width=370&height=150&name=ktf_eco-indicators%20(2).webp)
%20(1).webp?width=370&height=150&name=ktf_carbon-leakage%20(1)%20(1).webp)
.webp?width=370&height=150&name=ktf_wine_title%20(2).webp)
