
I bet you know how much carbon dioxide your car emits per kilometer. Maybe you are also well informed about the carbon reduction goals of the country where you live. But, when the working day is over, when you sit in a restaurant or relax at home with your partner or a friend by your side, deep in good conversation, when you start to enjoy life and when you open a delicious bottle of Spanish red wine – have you ever thought about its impact on the climate and its Carbon Footprint?
Carbon Footprint of a Bottle of Wine
Grupo ARCE has. The company derives its expertise from having calculated carbon footprints in the food sector and the electromechanical industry. Operating in Spain, a country which scores third when it comes to global red wine production, grupo ARCE can have a word to say concerning the environmental impact of wine.
PAS 2050 used to analyzed the carbon footprint
Following the PAS 2050 methodology, they analyzed the carbon footprint of a single bottle of wine. Not any wine, but a Verdejo from Rueda, to be precise. “Verdejo wines are aromatic, often soft and full-bodied,” reads Wikipedia. Are they also environmentally friendly?
This is where the analysis becomes interesting. Reducing climate impacts, no matter whether it concerns a car’s impact or a wine’s impact, requires a certain knowledge of how the product is made. This knowledge, together with convenient climate assessment software, makes for a detailed analysis of which parts of the product contribute the most, and of where the reduction potential is highest.

Part of the Process Map: Raw Materials and Manufacture in Umberto for Carbon Footprint (c) grupo arce
Here you can see what it might look like: the first two steps of a process map. The process map is essential for a precise carbon assessment.
Raw material production phase emits the most carbon emissions
From the first result, we can see that the raw material production phase emits the most. Raw materials account for 0.80 out of 1.28kg CO2-equivalent emissions. Remember: the functional unit analyzed here is one bottle and the approach is cradle to grave. That means we consider the full life cycle of a bottle of wine, from grape growing to wine making to drinking to throwing away the bottle.

Product Carbon Footprint of Wine: It’s not transport – it’s packaging

Which material exactly? The packaging parts consist, among others, of 4% for the cork, and of 85% for the glass.
Wow! Summing it up, the carbon footprint of a bottle of wine, which equals 1,2144 kg of carbon dioxide, includes a 39% contribution from the glass bottle alone!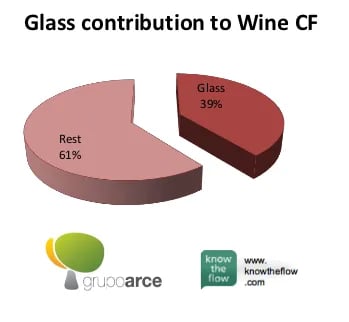
Analyzing the Carbon Footprint of Wine through Software Solutions
The creation of product carbon footprints is inconceivable without the use of software and suitable LCA databases. The analyses of the PCF of wine presented here were carried out using our LCA software Umberto. Umberto allows complex production systems to be modeled graphically, including other relevant life cycle phases such as raw material extraction, distribution, use phase and end-of-life. In this way, environmental impacts can be analyzed and evaluated holistically and hotspots for optimization can be identified.